


Businesses generate enormous amounts of data every day. Every customer interaction, sales transaction, support request, financial record, inventory update, and operational activity adds to this growing pool of information.
But having data alone doesn’t guarantee better decisions.
Many organisations struggle because their data is spread across multiple systems, reports, and spreadsheets. Teams spend more time collecting information than understanding what it actually means. As a result, valuable opportunities are missed, problems go unnoticed, and decision-making slows down.
The real value lies in turning raw data into actionable insights; insights that help businesses improve performance, identify trends, solve problems, and make confident decisions.
This is where Business Intelligence (BI) plays a crucial role.
In this blog, we’ll explore how businesses can transform raw data into meaningful insights, the steps involved in the process, and how iDashboard helps organisations unlock the full value of their business data.
Actionable insights
Actionable insights answer important business questions such as:
- Which products are performing best?
- Which customers require attention?
- Where are operational bottlenecks?
- Which business processes need improvement?
- How are sales trending over time?
- Which departments need additional resources?
Instead of simply presenting numbers, actionable insights provide context, patterns, and recommendations that support decision-making.
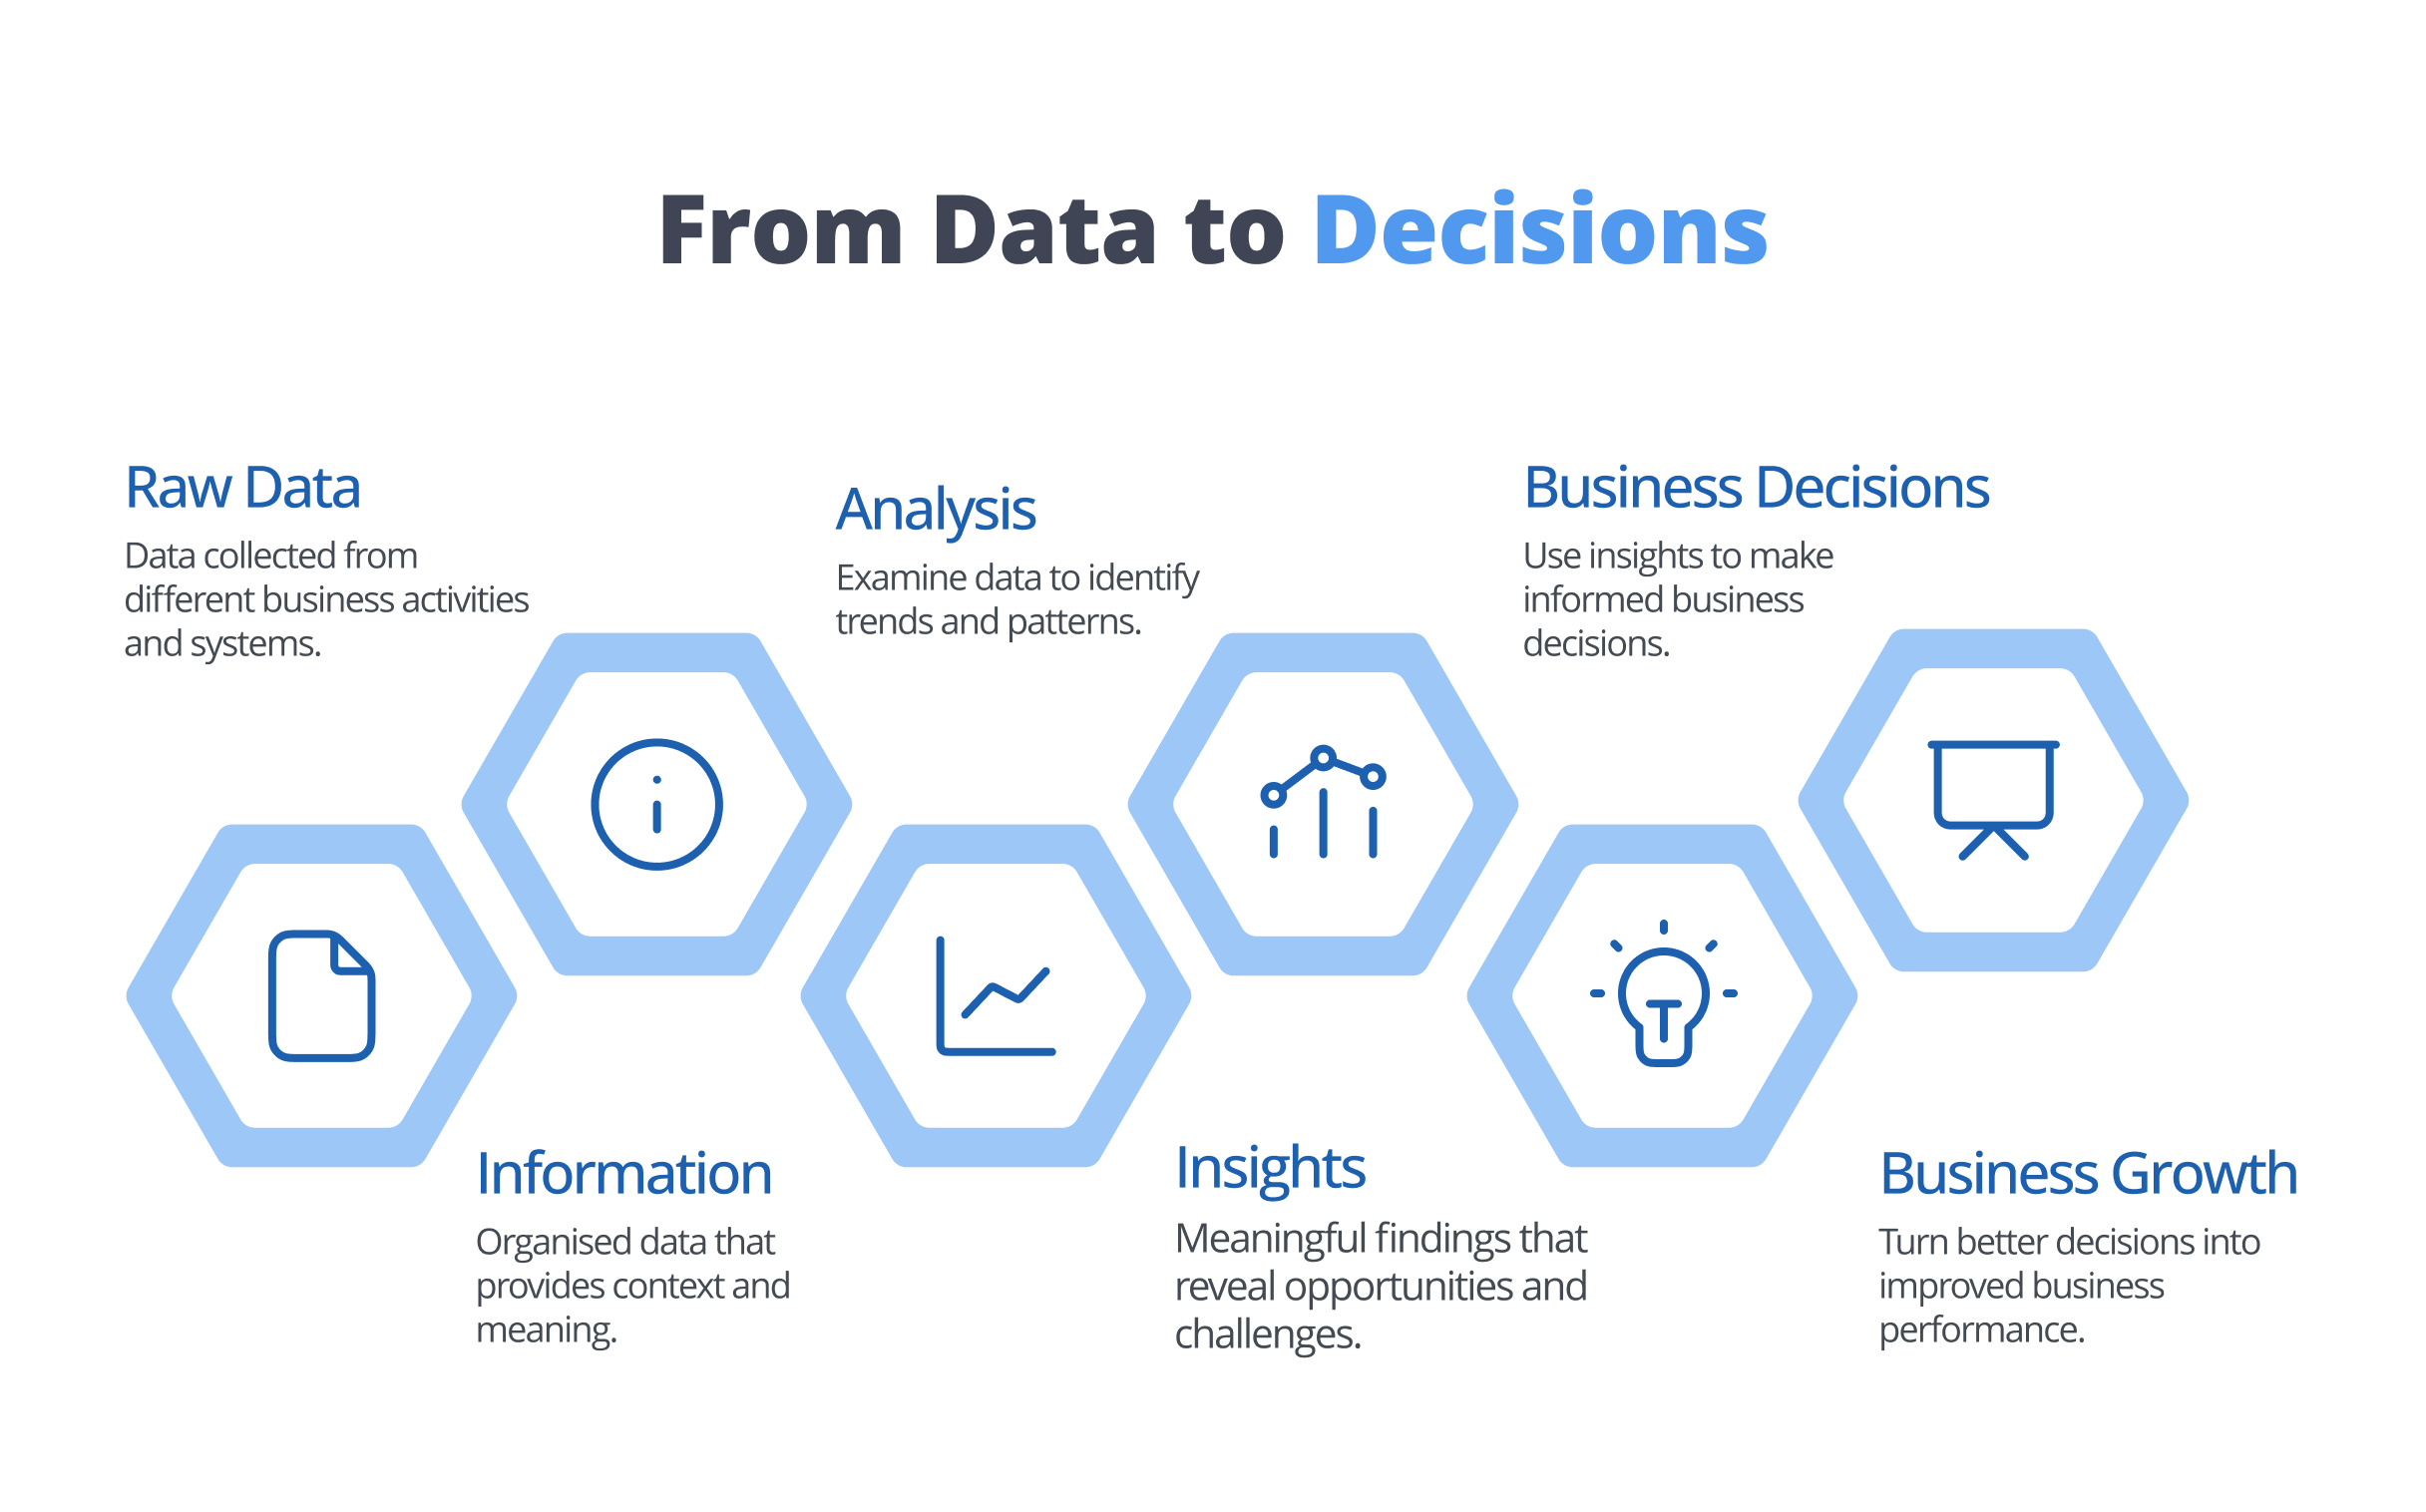
Why raw data alone isn’t enough
Businesses often collect data from multiple sources, including:
- ERP systems
- CRM platforms
- Finance applications
- HR systems
- Customer service tools
- Inventory systems
- Marketing platforms
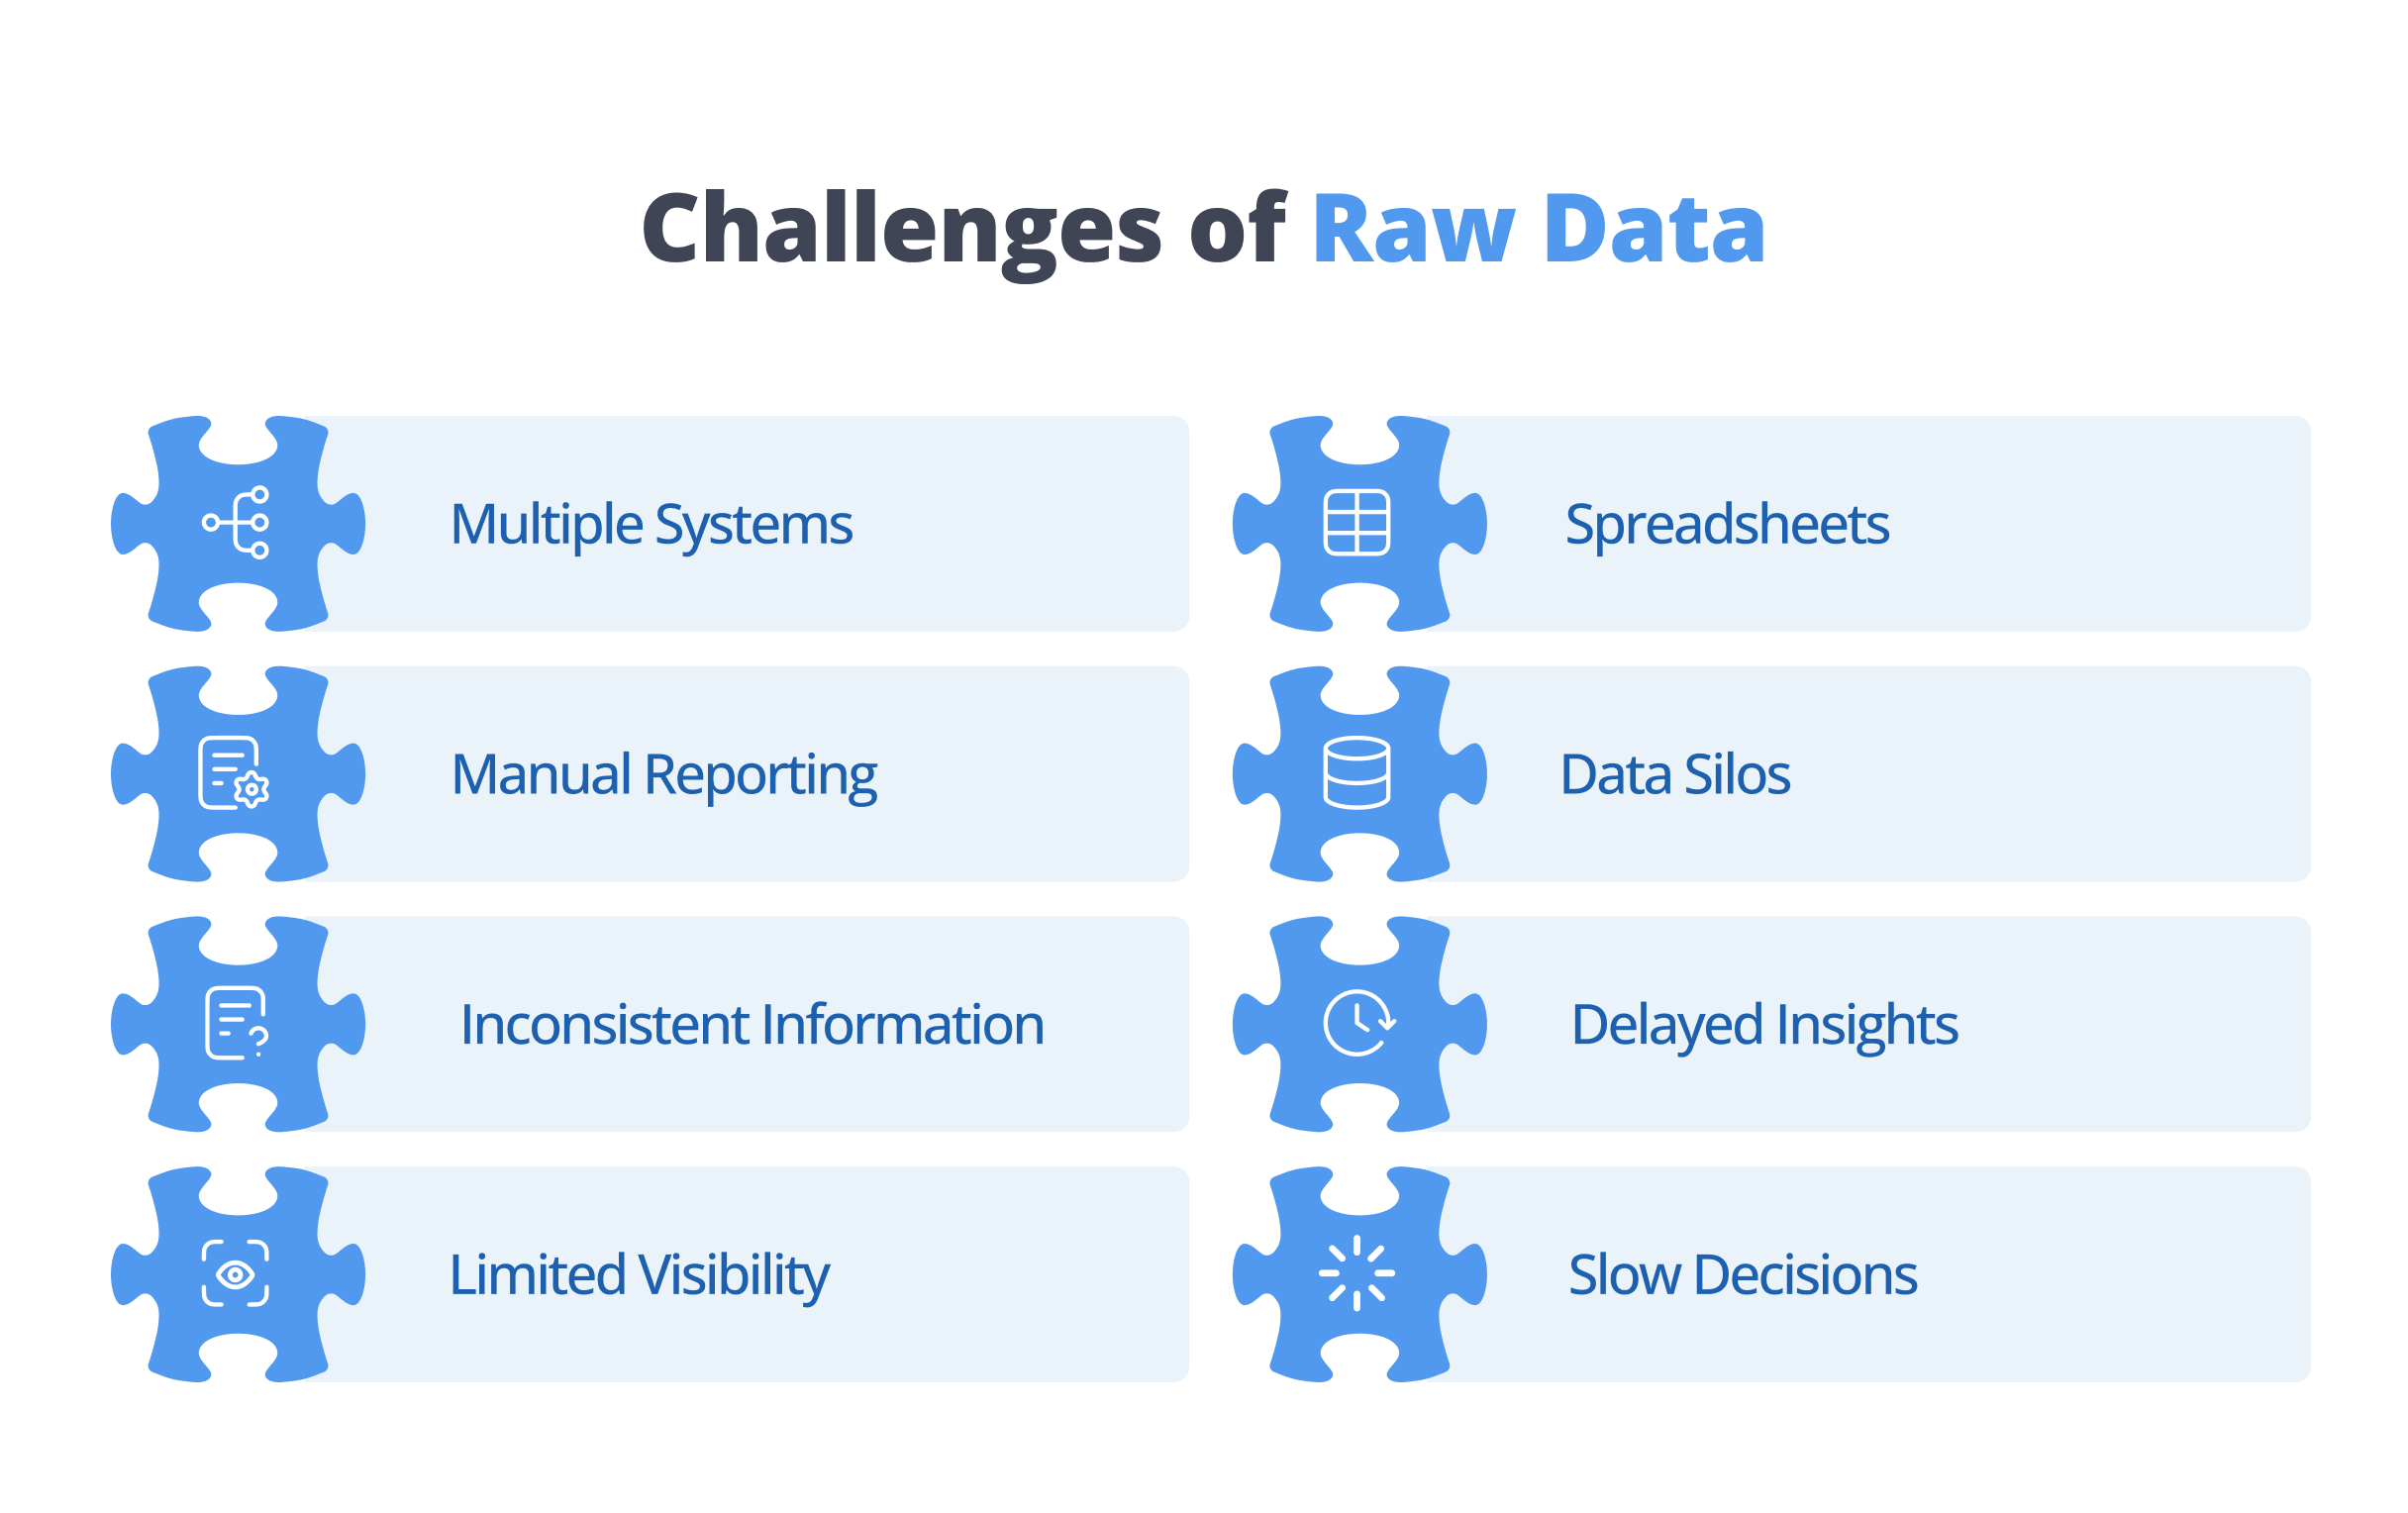
When this information remains disconnected, organisations often experience:
- Multiple versions of reports
- Inconsistent data
- Time-consuming analysis
- Limited visibility
- Delayed decisions
- Missed business opportunities
Simply collecting more data does not improve business performance. The ability to analyse and understand that data is what creates value.
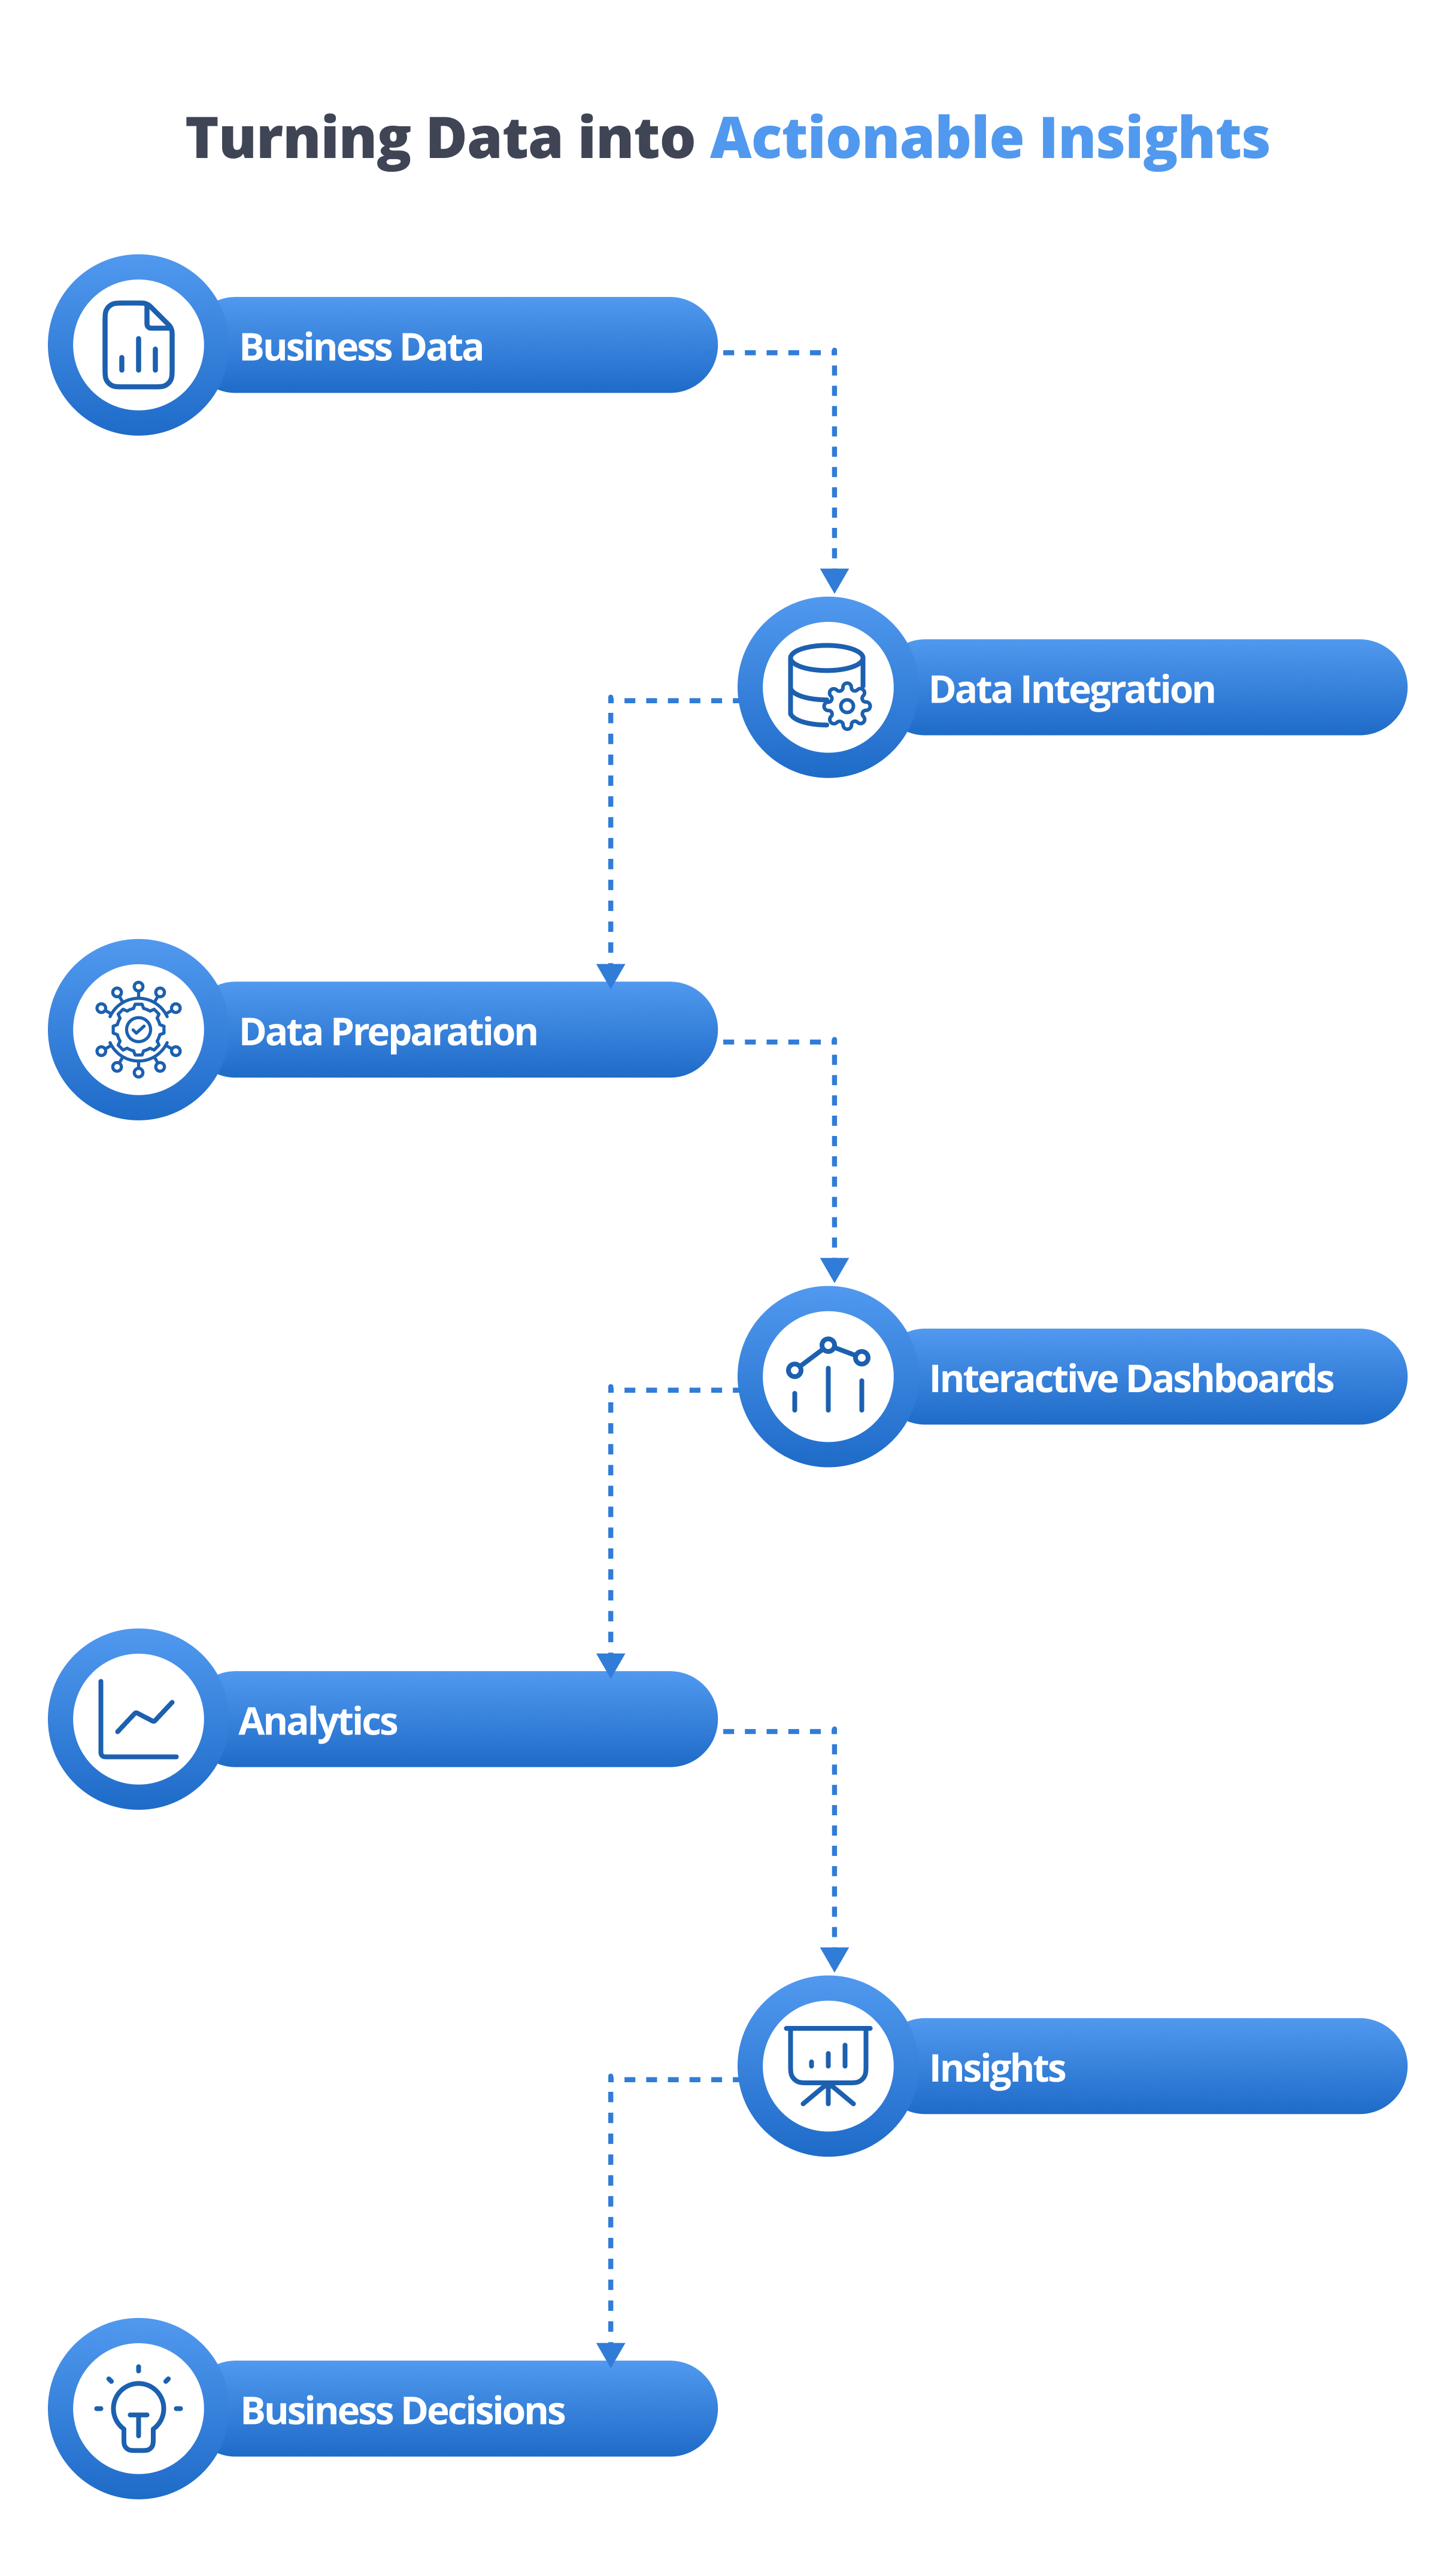
How businesse can turn raw Data into Actionable insights:-
Transforming data into insights requires a structured approach.
Bring data together
The first step is consolidating data from different business systems into a single platform. This creates one reliable source of information for the entire organisation.
Benefits
- Centralised information
- Better consistency
- Improved collaboration
Clean and organise the data
Before analysing information, businesses should remove duplicate records, correct inconsistencies, and standardise data formats. Well-organised data leads to more reliable insights.
Benefits
- Better data quality
- Accurate reporting
- Improved confidence
Visualise business performance
Interactive dashboards make complex data easier to understand. Instead of reviewing lengthy spreadsheets, decision-makers can monitor performance through charts, graphs, KPIs, and visual reports.
Benefits
- Easier interpretation
- Faster reporting
- Improved visibility
Identify trends and patterns
Business intelligence platforms help uncover relationships that may not be obvious in raw data.
Examples include:
- Sales performance trends
- Customer purchasing behaviour
- Operational bottlenecks
- Inventory movement
- Financial performance
Benefits
- Better forecasting
- Improved planning
- Earlier problem detection
Monitor key performance indicators (KPIs)
Tracking KPIs helps businesses understand whether they are meeting their goals.
Examples include:
- Revenue growth
- Sales performance
- Customer satisfaction
- Order fulfilment
- Project completion
- Operational efficiency
Benefits
- Continuous improvement
- Goal alignment
- Better performance management
Make data-driven decisions
The final step is using insights to improve business performance. Rather than relying on assumptions, leaders can make informed decisions supported by accurate, real-time information.
Benefits
- Greater confidence
- Faster decision-making
- Better business outcomes
Traditional reporting vs business intelligence
| Traditional Reporting | Business Intelligence |
|---|---|
| Static reports | Interactive dashboards |
| Manual data collection | Automated data integration |
| Spreadsheet-based analysis | Real-time analytics |
| Limited visibility | Unified business view |
| Difficult trend analysis | Easy identification of trends |
| Periodic reporting | Continuous performance monitoring |
| Reactive decision-making | Proactive decision-making |
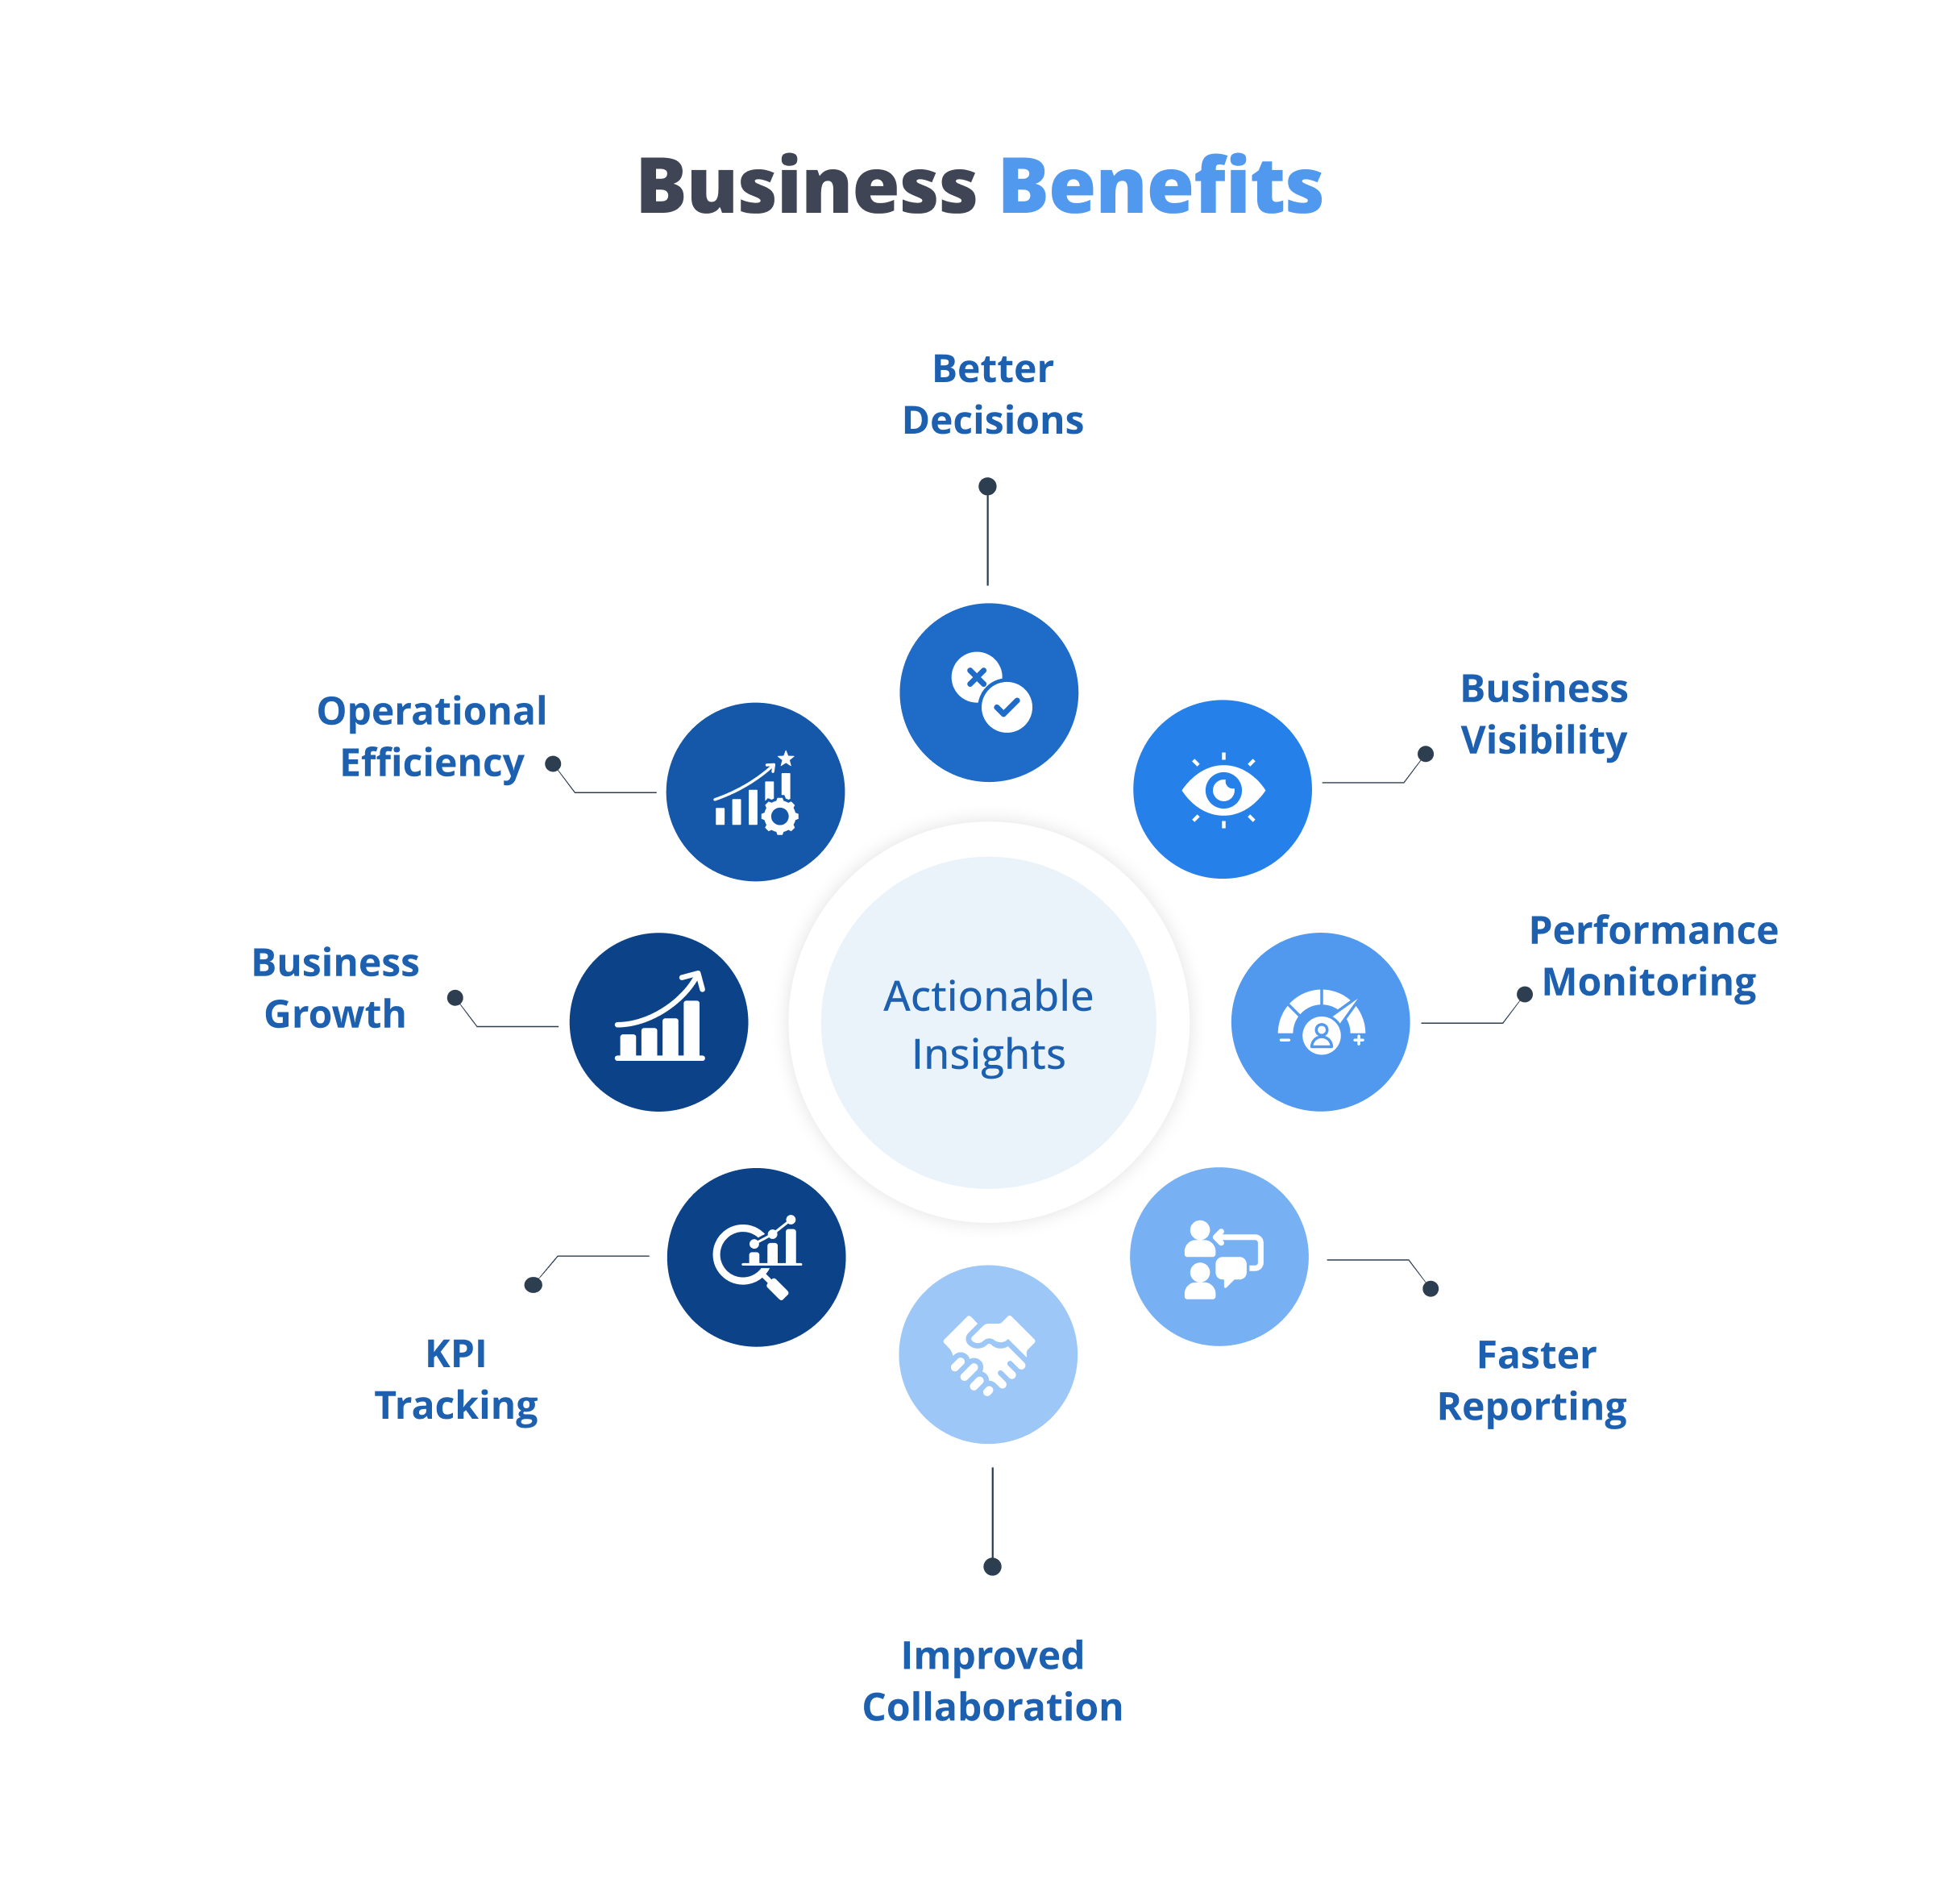
Benefits of actionable insights
Turning raw data into actionable insights benefits every part of the organisation.
Why choose iDashboard for business intelligence?
Turning data into actionable insights requires more than collecting information; it requires a platform that makes data easy to understand, analyse, and act upon.
iDashboard by CATS4U is a self-service business intelligence and data visualisation platform designed to transform complex business data into interactive dashboards and meaningful insights.
By connecting information from multiple business systems, iDashboard enables organisations to monitor KPIs, analyse trends, create custom dashboards, and make faster, data-driven decisions.
Key features of iDashboard:
- Interactive dashboards
- Self-service reporting
- Real-time data visualisation
- KPI monitoring
- Advanced analytics
- Multi-source data integration
- Custom dashboards
- Scheduled reports
- Role-based access
- Native integration across the CATS4U suite
Whether you’re analysing sales performance, monitoring financial metrics, tracking operational efficiency, or reviewing customer service performance, iDashboard helps transform data into insights that drive smarter business decisions.
Conclusion
Every organisation has access to valuable business data, but data alone doesn’t create value. The real advantage comes from transforming that information into actionable insights that guide everyday decisions and long-term strategy.
By bringing data together, analysing trends, monitoring KPIs, and visualising performance, businesses can improve efficiency, respond faster to challenges, and uncover new growth opportunities.
Business intelligence makes this possible by converting complex information into clear, meaningful insights that every team can understand and use.
With iDashboard, organisations can centralise business data, build interactive dashboards, and empower decision-makers with real-time insights that drive better outcomes across the enterprise.
Frequently asked questions
Actionable insights are meaningful conclusions derived from business data that help organisations make informed decisions and improve business performance.
Raw data provides information but often lacks context. Businesses need analytics and visualisation to identify trends, understand performance, and make informed decisions.
Businesses can:
- Consolidate data from multiple sources
- Clean and organise data
- Visualise information through dashboards
- Analyse trends
- Monitor KPIs
- Make data-driven decisions
Business intelligence collects, analyses, and visualises business data through dashboards and reports, making it easier to identify trends and support decision-making.
Business intelligence supports sales, finance, operations, customer service, human resources, and executive leadership.
iDashboard connects data from multiple business systems, creates interactive dashboards, monitors KPIs, and provides real-time analytics that help organisations turn raw data into meaningful, actionable insights.
