


Every business generates data every day. Sales transactions, customer interactions, financial records, inventory updates, employee performance, and operational activities all create valuable information.
However, collecting data is only the beginning. The real challenge is turning that data into meaningful insights that help businesses make informed decisions.
Many organisations still rely on spreadsheets, static reports, or disconnected systems to analyse business performance. While these methods provide information, they often make it difficult to see trends, identify opportunities, or respond quickly to changing business conditions.
This is where Business Intelligence (BI) makes a difference.
Business intelligence helps organisations collect, analyse, visualise, and interpret data from multiple sources, transforming raw information into actionable insights that support smarter business decisions.
In this blog, we’ll explore what Business Intelligence is, why every business needs it, its key benefits, and how iDashboard helps organisations make better decisions through intelligent dashboards and data visualisation.
What is business intelligence?
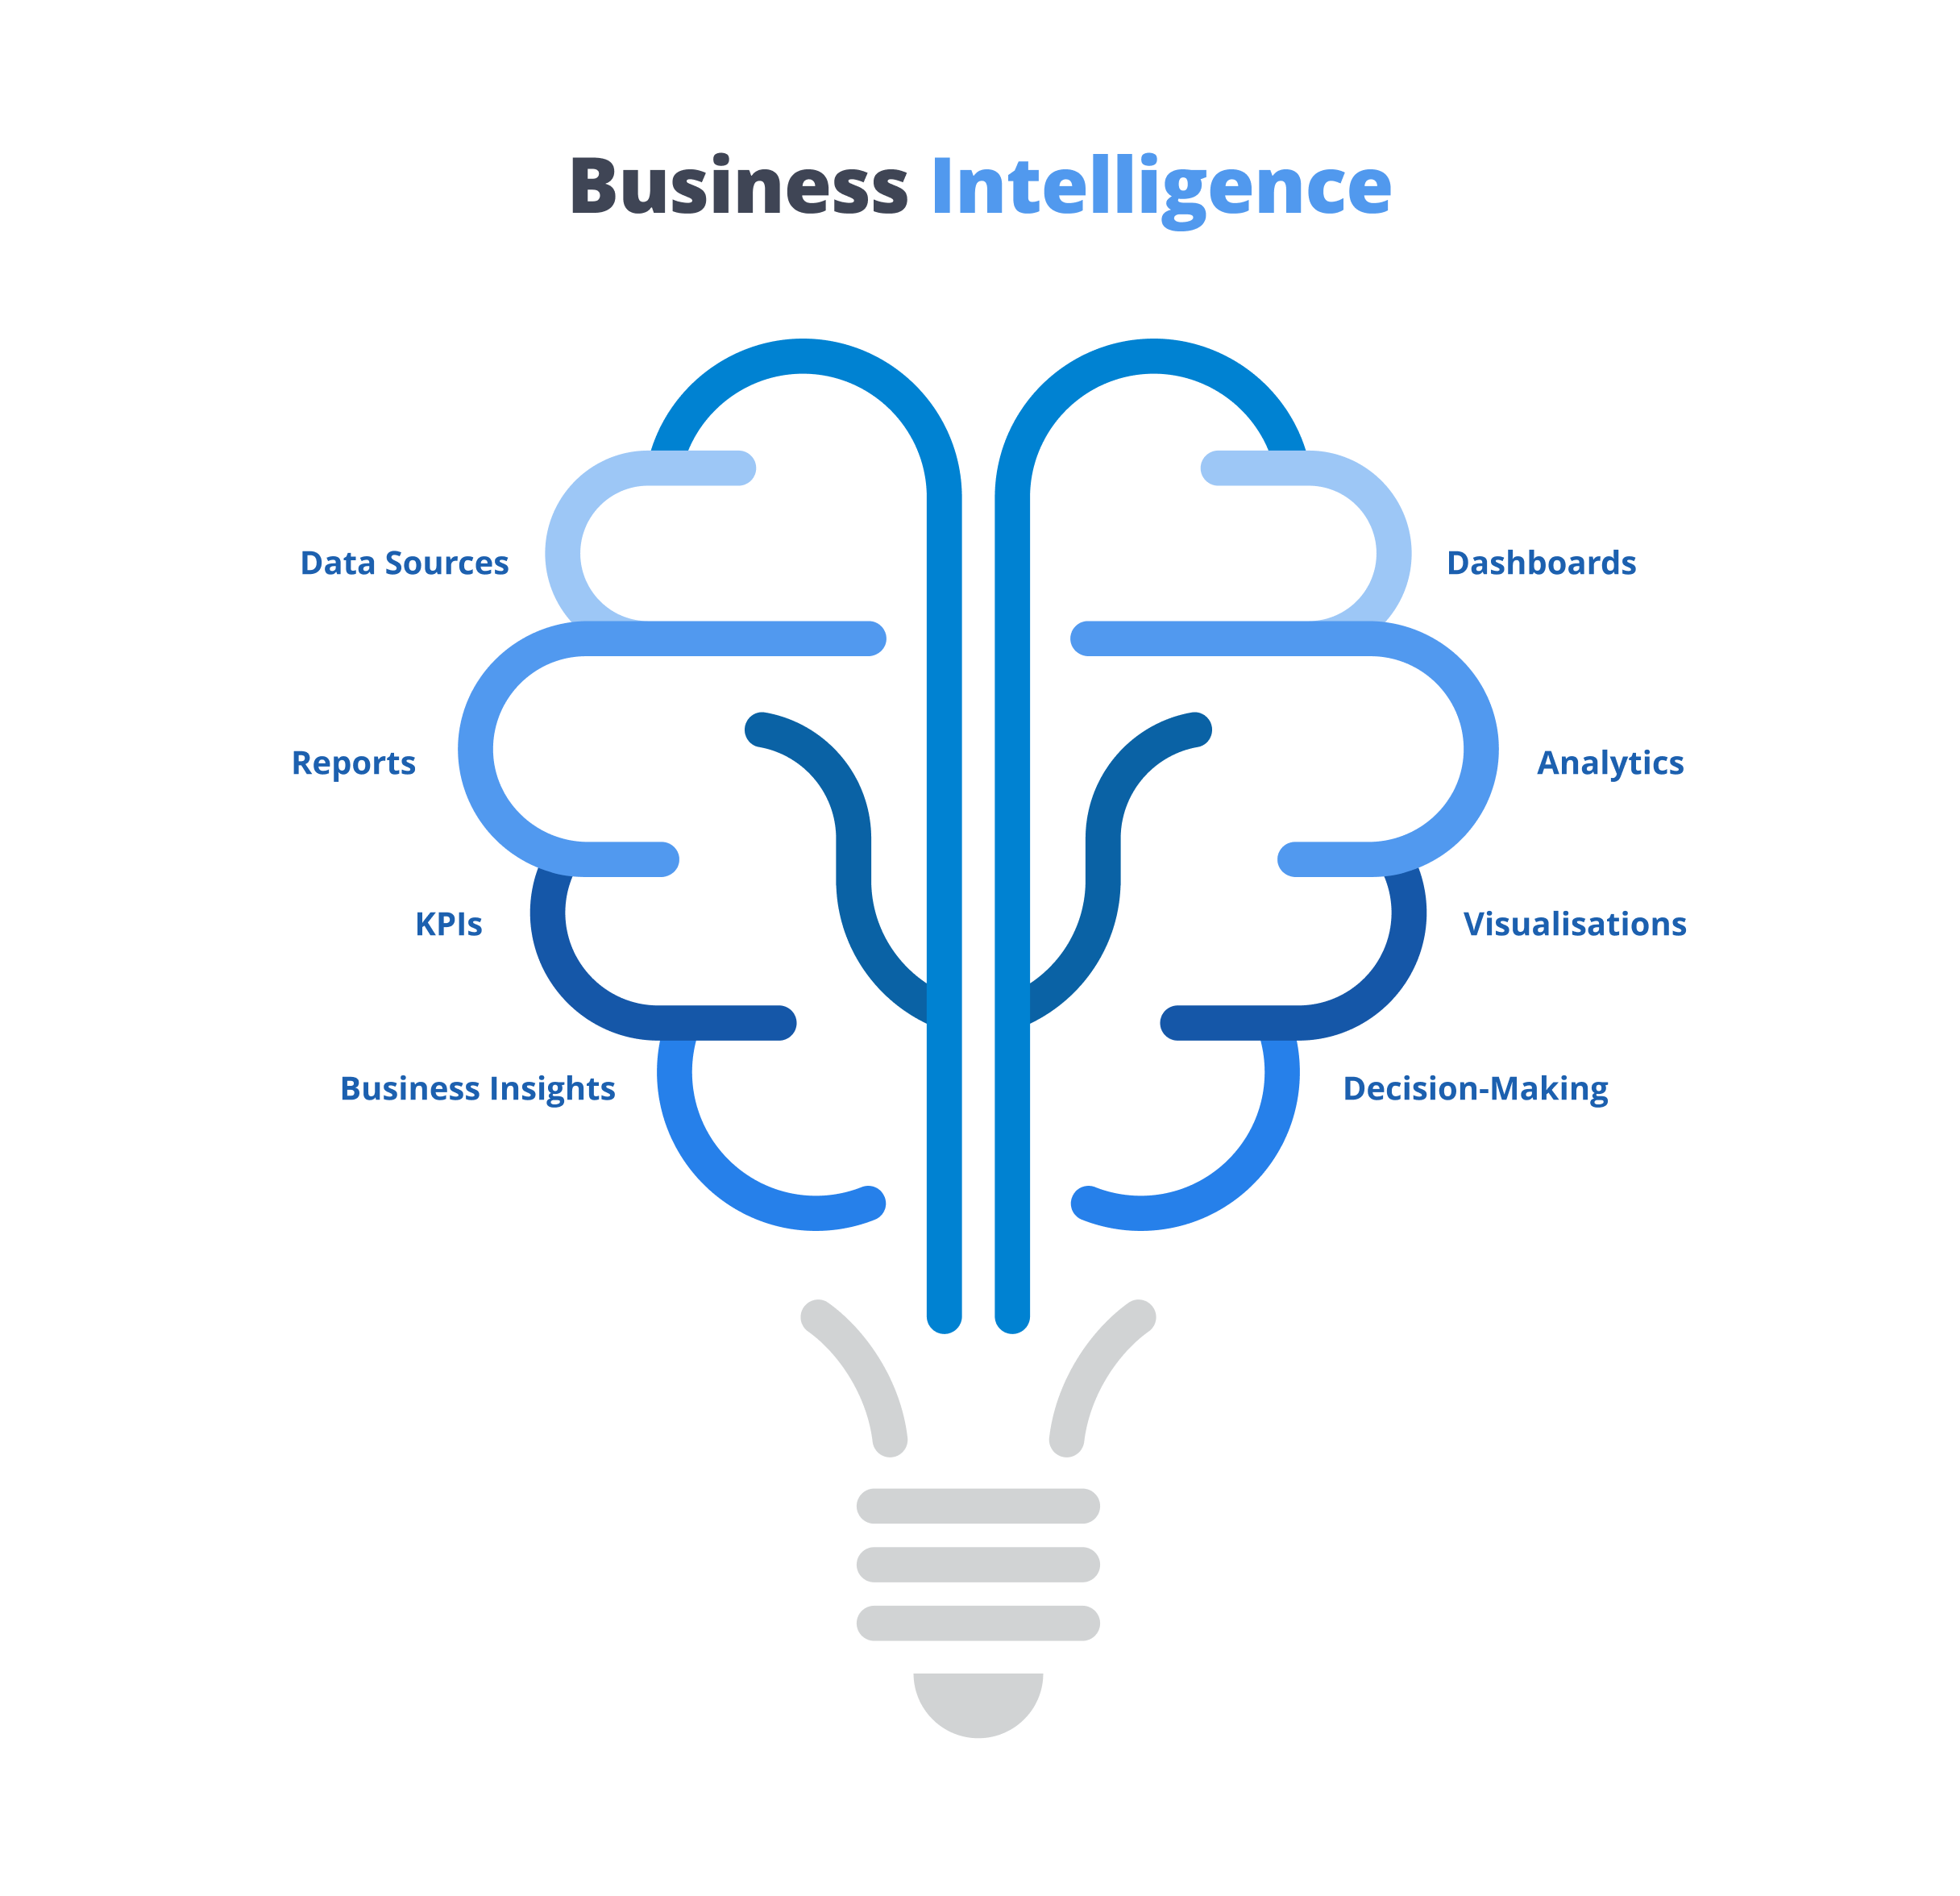
Business intelligence is the process of collecting, organising, analysing, and presenting business data to help organisations make informed decisions.
Instead of reviewing reports from different systems individually, BI brings together information from across the organisation into a single platform with interactive dashboards, reports, and visualisations.
Business intelligence helps organisations monitor:
- Sales performance
- Financial performance
- Customer trends
- Operational efficiency
- Inventory levels
- Employee productivity
- Project progress
- Business KPIs
Rather than simply displaying data, BI transforms it into meaningful insights that support faster and better decision-making.
Why does every business need business intelligence?
As businesses grow, they generate more data than ever before.
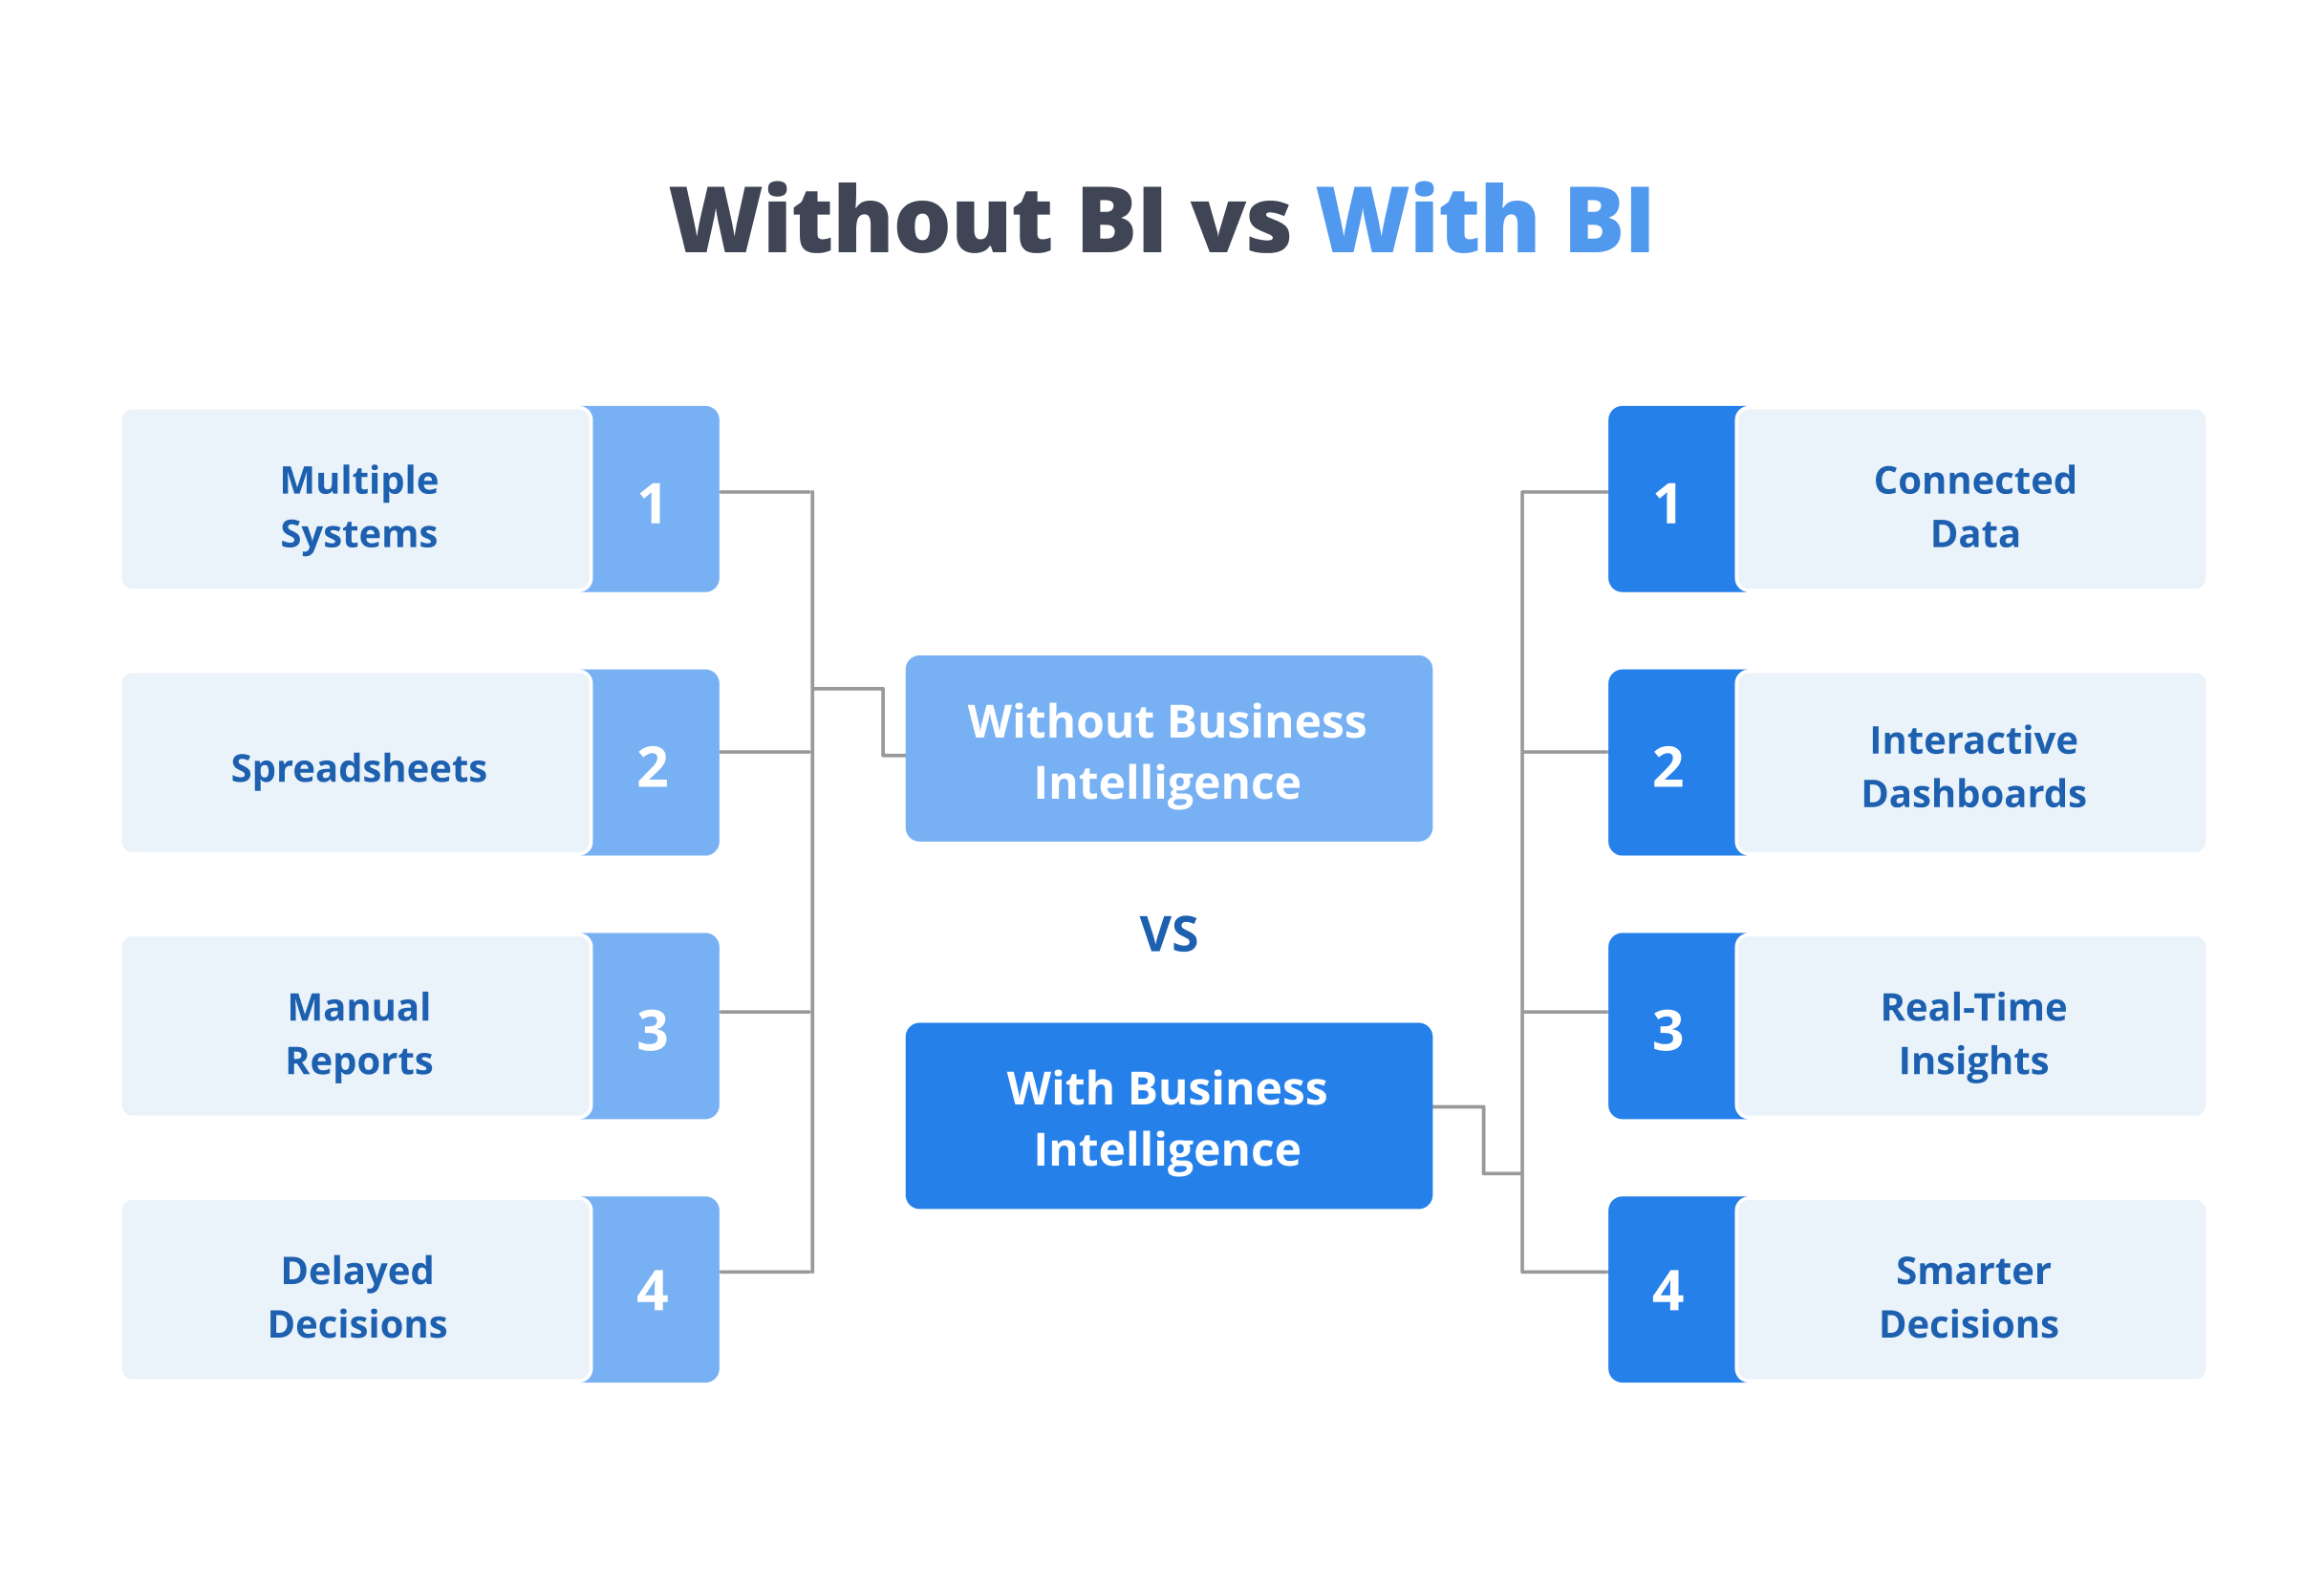
Without business intelligence, organisations often face challenges such as:
- Information spread across multiple systems
- Time-consuming report creation
- Limited visibility into business performance
- Difficulty identifying trends
- Delayed decision-making
- Inconsistent reporting
- Lack of real-time insights
Business intelligence solves these challenges by creating a central view of business performance that everyone can access and understand.
How does business intelligence work?
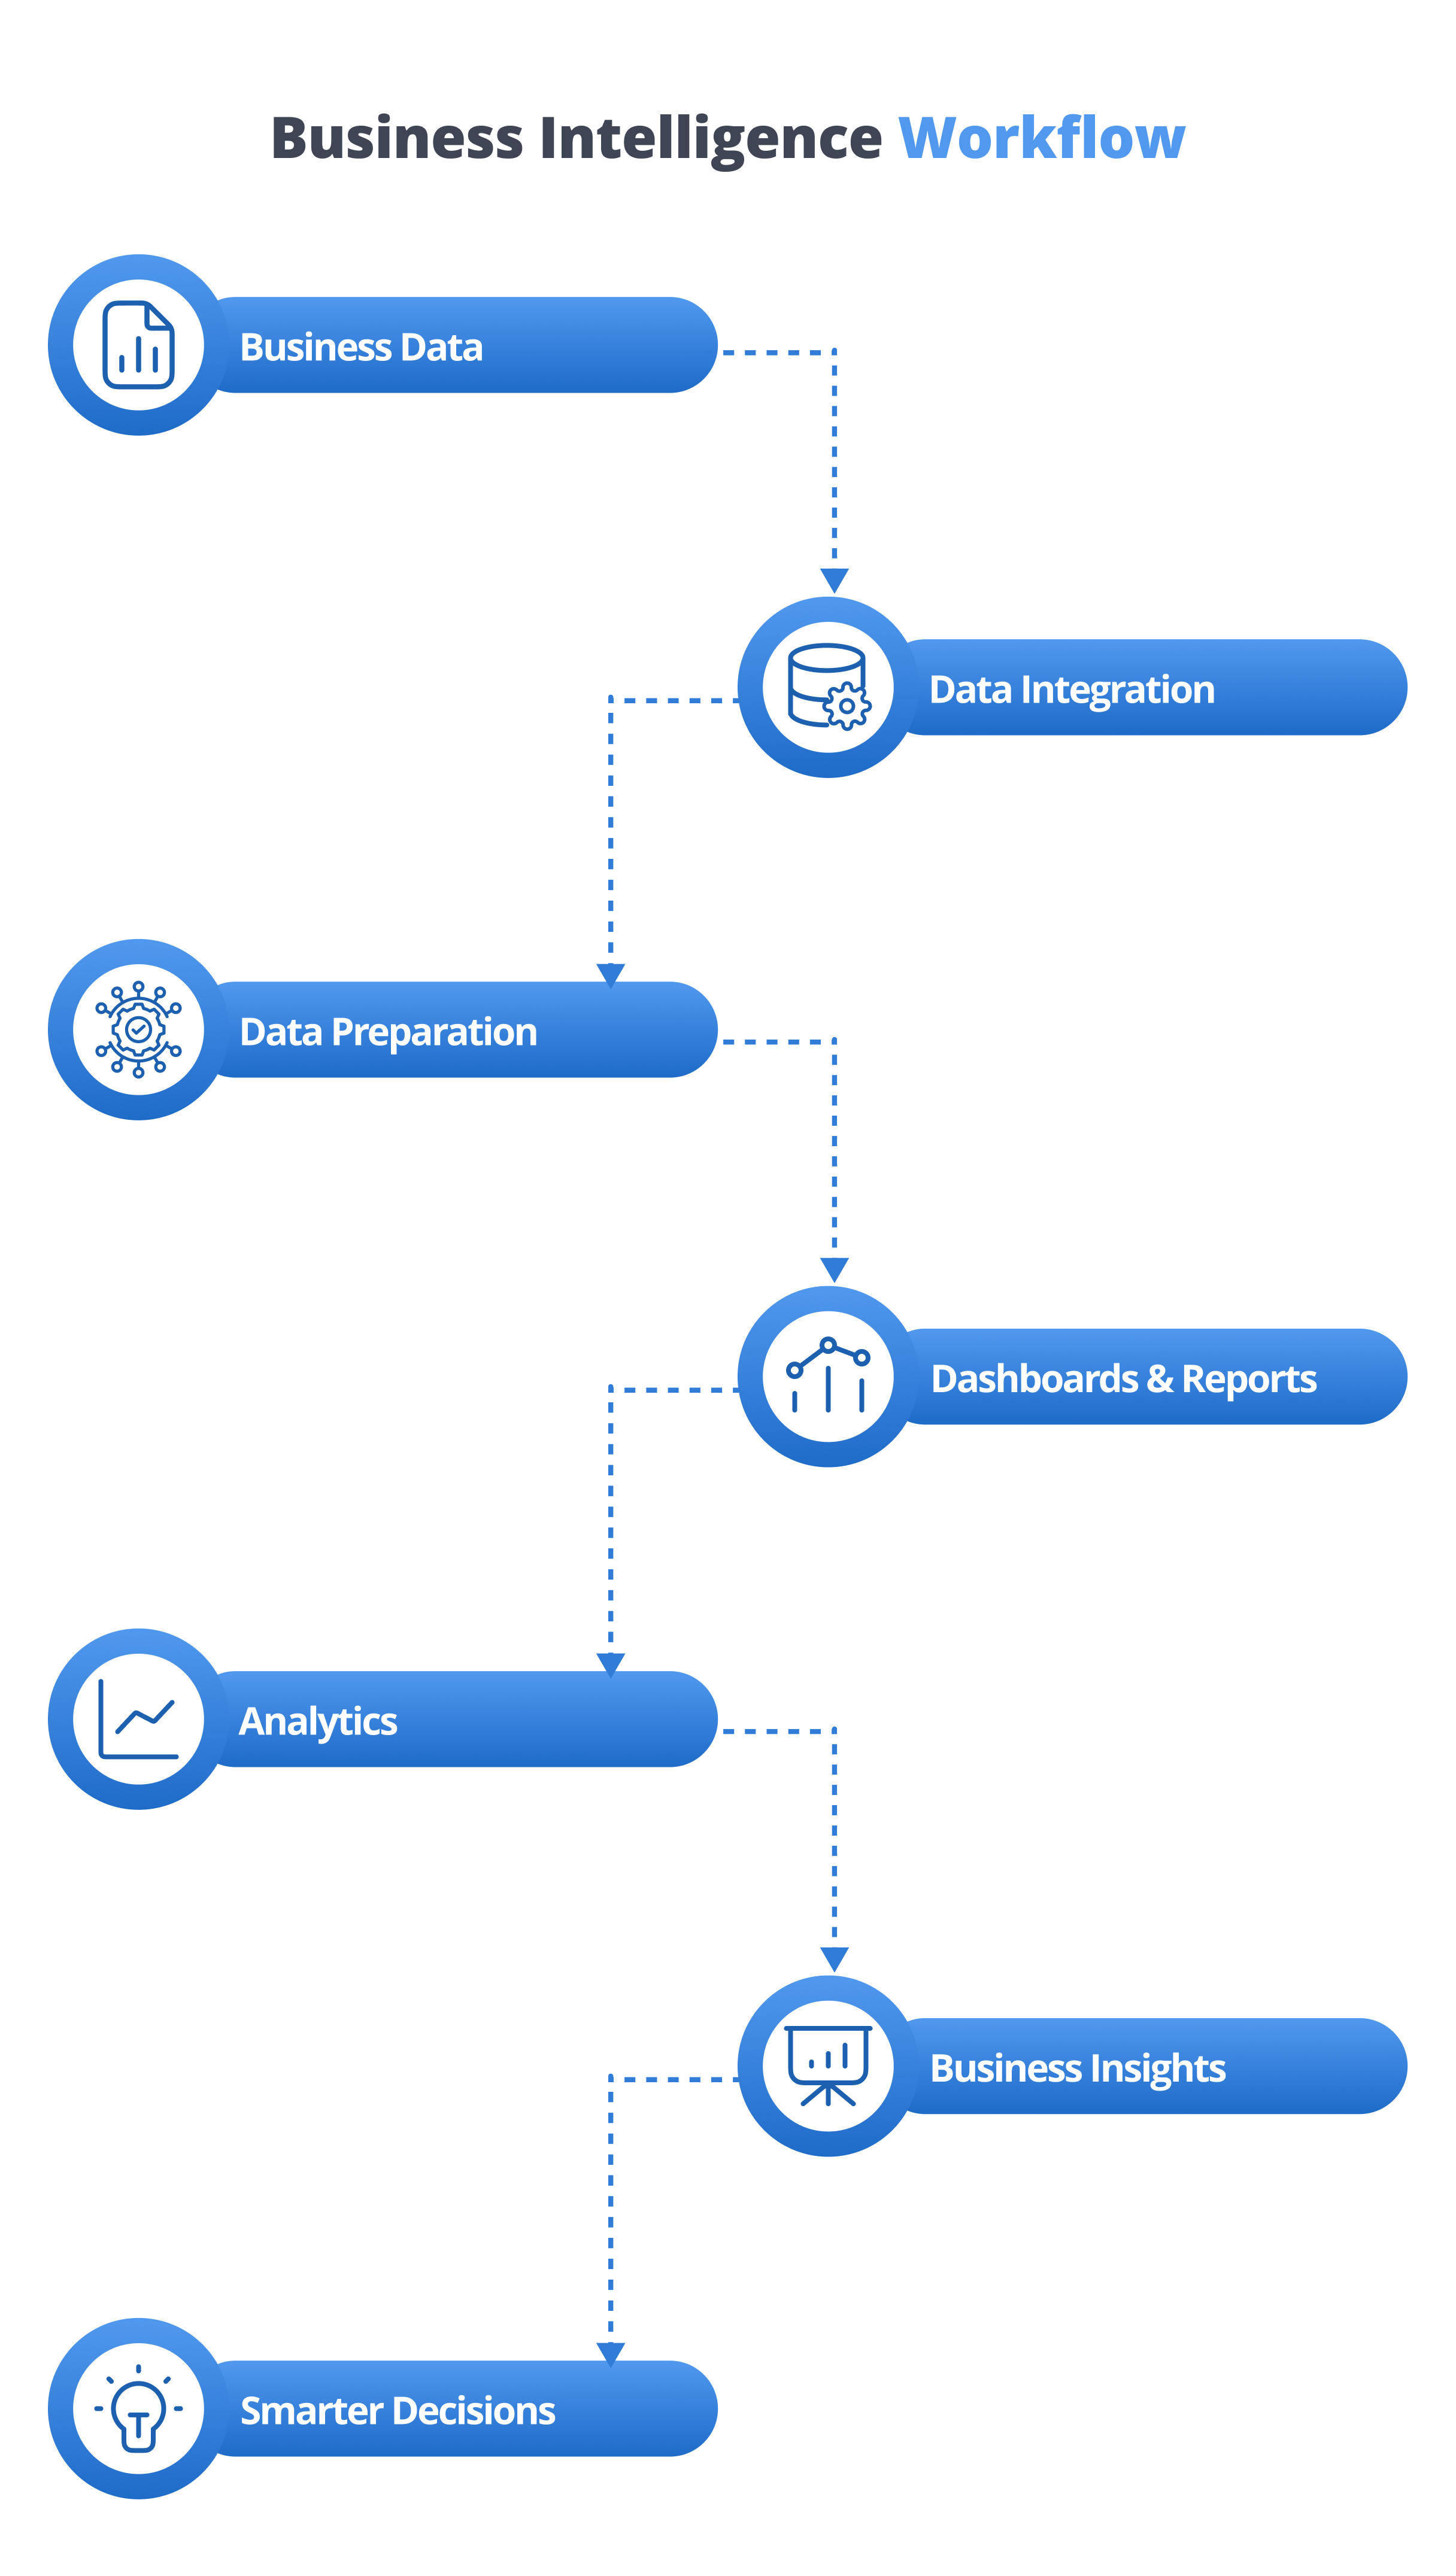
A business intelligence platform connects data from multiple sources and transforms it into meaningful dashboards and reports.
A typical BI workflow includes:
- Data is collected from multiple business systems
- Information is consolidated into a central platform
- Data is cleaned and organised
- Dashboards and reports are generated
- KPIs are visualised in real time
- Business users analyse trends and make informed decisions
This process helps organisations move from raw data to actionable insights quickly and efficiently.
Key benefits of business intelligence
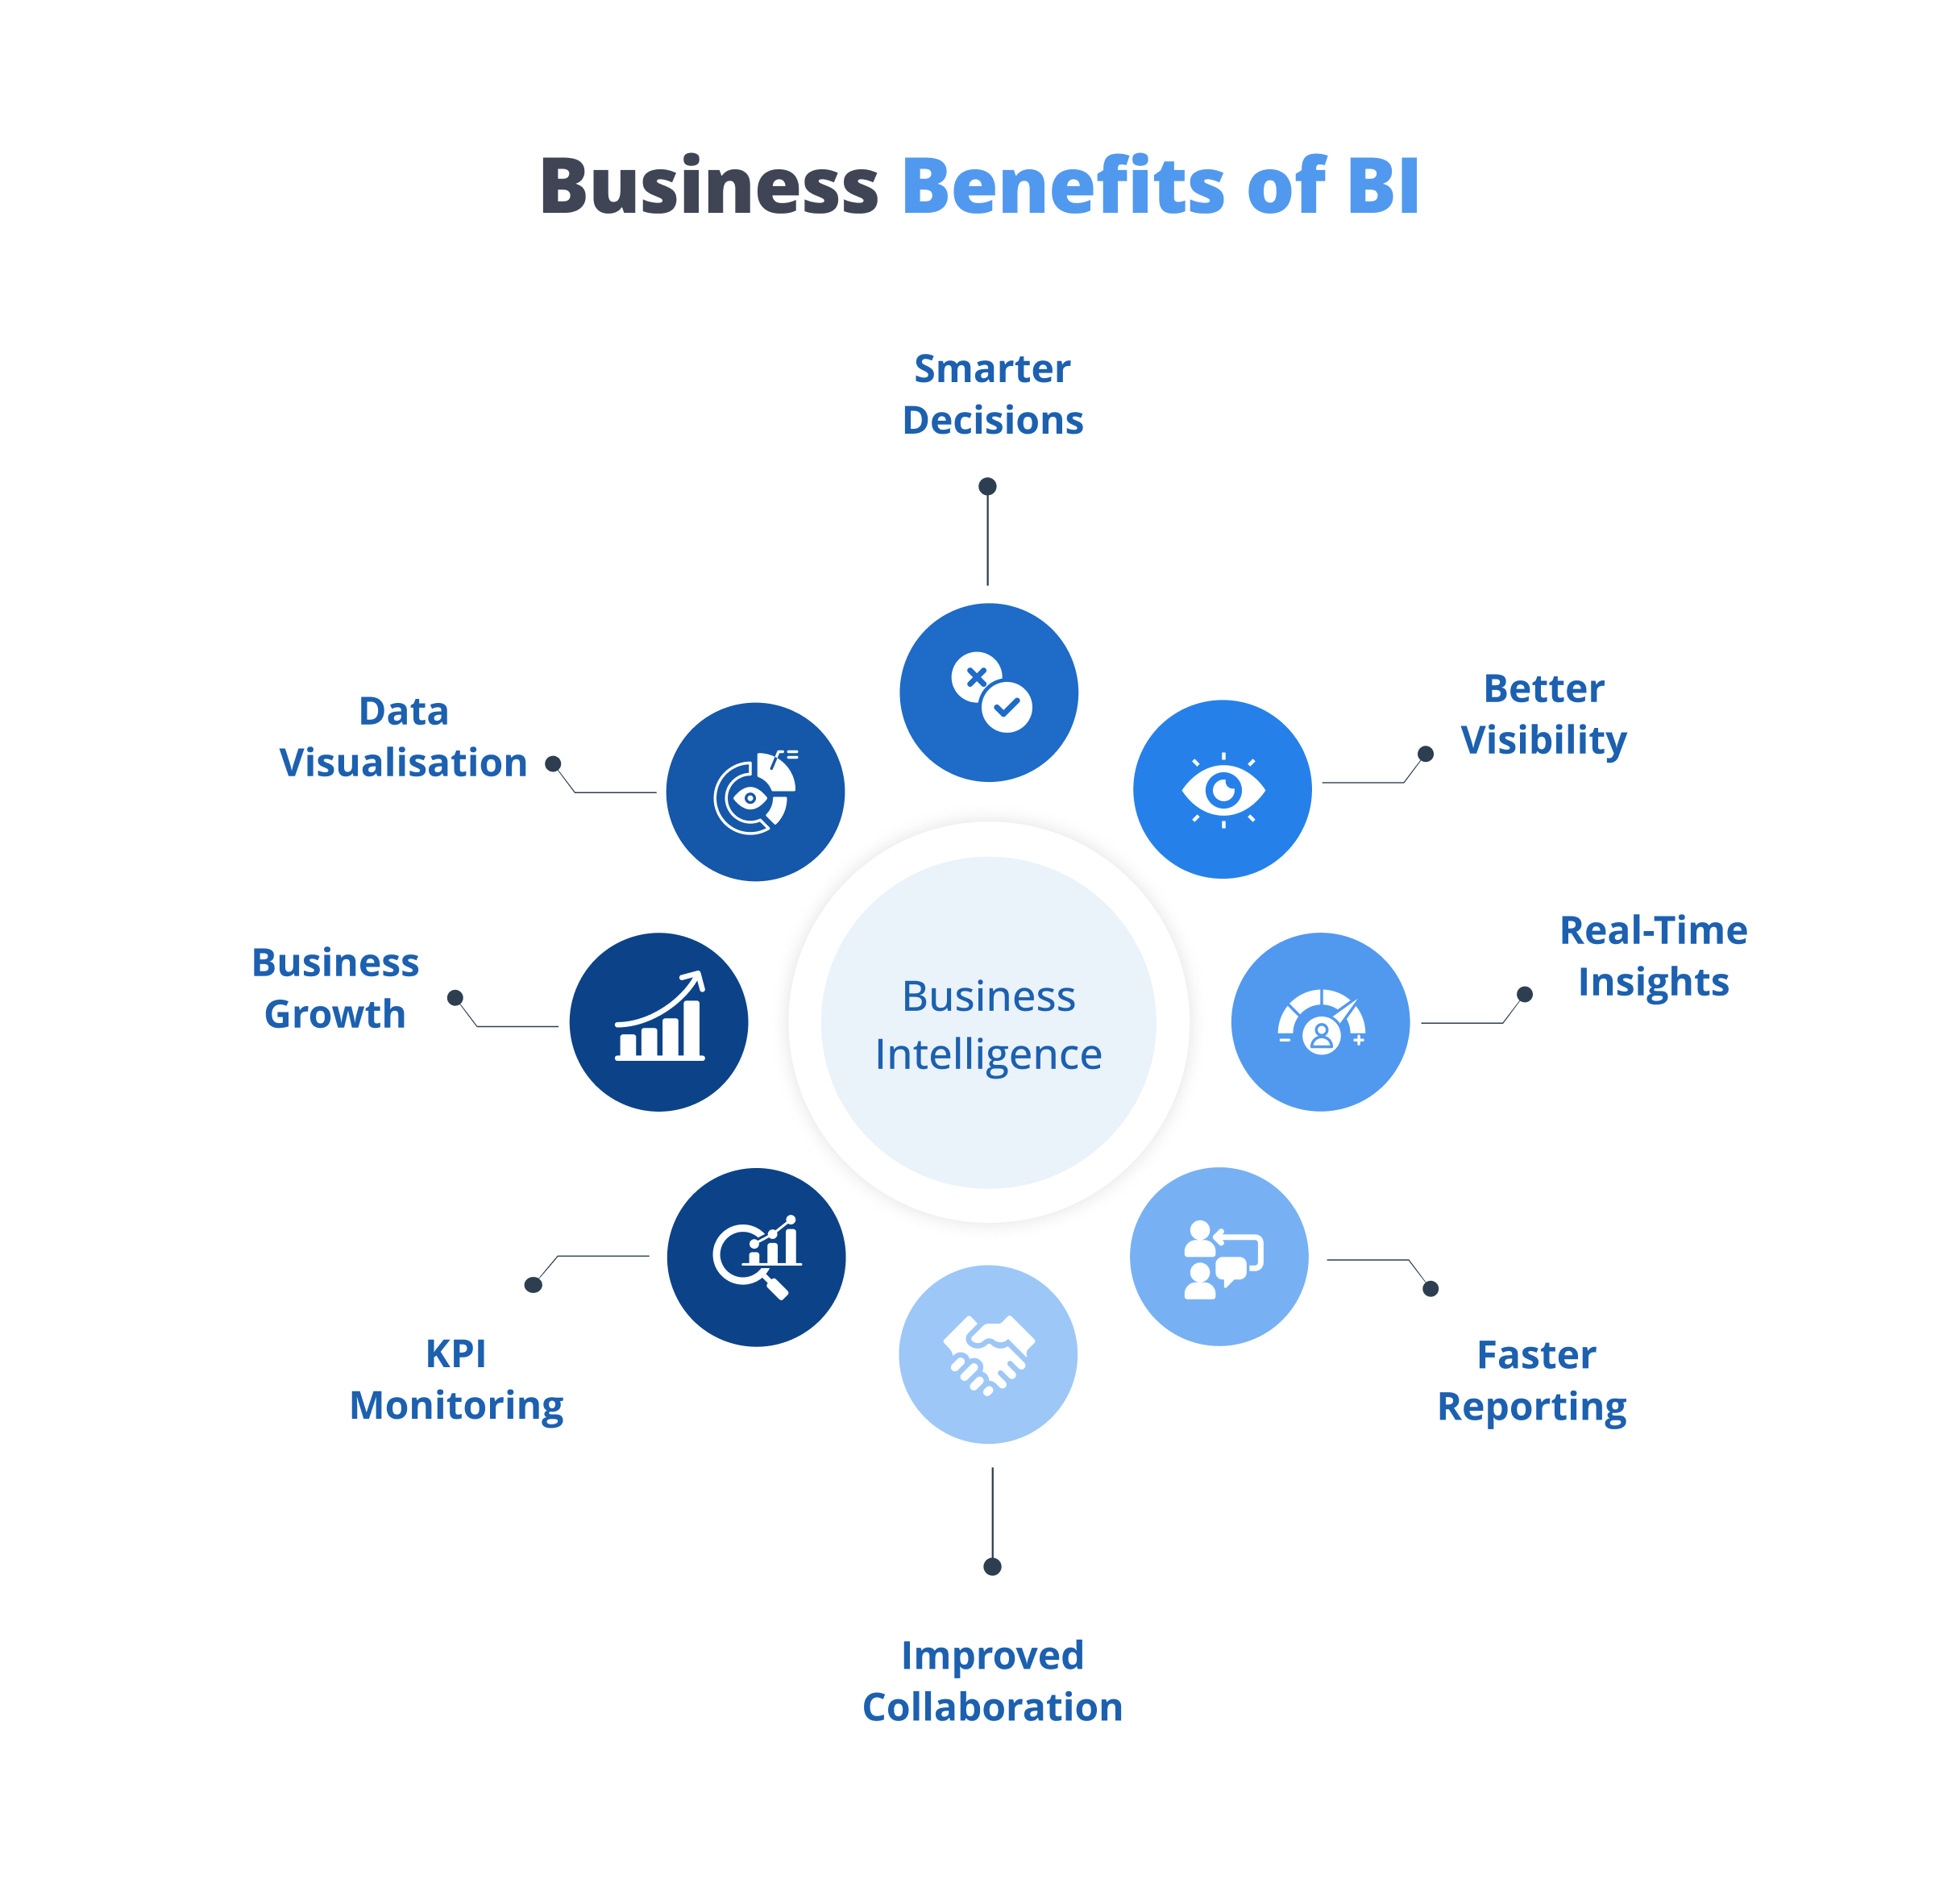
Business intelligence creates value across every department by making business information easier to understand and act upon.
Better decision-making
Business Intelligence provides timely, accurate, and relevant information that helps leaders make confident decisions.
Benefits
- Faster decisions
- Better planning
- Reduced guesswork
Complete business visibility
BI brings information from different systems into one dashboard. Teams can monitor performance across multiple business functions without switching between applications.
Benefits
- Unified reporting
- Greater transparency
- Easier monitoring
Real-time performance monitoring
Interactive dashboards allow organisations to monitor KPIs as business activities occur.
Benefits
- Faster responses
- Improved operational control
- Better business awareness
Identify trends and opportunities
Business intelligence helps organisations recognise patterns that may otherwise go unnoticed.
Examples include:
- Customer buying behaviour
- Sales trends
- Revenue performance
- Operational bottlenecks
- Inventory movement
Benefits
- Better forecasting
- Improved planning
- Smarter business strategies
Improve collaboration
When everyone works from the same dashboards and reports, teams have a consistent understanding of business performance.
Benefits
- Better communication
- Shared visibility
- Faster collaboration
Reduce manual reporting
Instead of creating reports manually every week or month, BI platforms automate reporting and dashboard generation.
Benefits
- Reduced manual effort
- Improved reporting accuracy
- Increased productivity
Traditional reporting vs business intelligence
| Traditional Reporting | Business Intelligence |
|---|---|
| Static reports | Interactive dashboards |
| Manual report generation | Automated reporting |
| Data stored in multiple systems | Centralised business insights |
| Delayed reporting | Real-time visibility |
| Limited visualisation | Rich charts and dashboards |
| Difficult trend analysis | Easy trend identification |
| Reactive decision-making | Data-driven decision-making |
Common business intelligence use cases
Business intelligence can support almost every business function.
Why choose iDashboard for business intelligence?
Business intelligence is most effective when insights are easy to access, understand, and act upon. Organisations need more than reports; they need interactive dashboards that bring together data from across the business.
iDashboard by CATS4U is a self-service Business Intelligence and data visualisation platform designed to help organisations transform complex business data into meaningful insights.
By connecting multiple data sources into one unified platform, iDashboard enables business users to monitor KPIs, analyse trends, create interactive dashboards, and make informed decisions without relying on manual reporting.
Key features of iDashboard:
- Interactive dashboards
- Self-service reporting
- Real-time data visualisation
- KPI monitoring
- Advanced analytics
- Data integration from multiple sources
- Custom dashboards
- Role-based access
- Scheduled reporting
- Native integration across the CATS4U suite
Whether you’re tracking sales, financial performance, customer service, or operational metrics, iDashboard provides the visibility needed to improve business performance and support data-driven decision-making.
Conclusion
Data has become one of the most valuable assets for modern businesses, but its value depends on how effectively it is analysed and used.
Business intelligence enables organisations to move beyond static reports and spreadsheets by transforming data into meaningful insights through interactive dashboards and real-time analytics.
By improving visibility, simplifying reporting, and supporting informed decision-making, Business Intelligence helps organisations respond faster to changing business needs and uncover new growth opportunities.
With iDashboard, businesses can centralise their data, monitor performance through intuitive dashboards, and empower teams with the insights needed to make smarter, faster, and more confident decisions.
Frequently asked questions
Business intelligence is the process of collecting, analysing, and visualising business data to help organisations make informed decisions through dashboards, reports, and analytics.
Business intelligence improves decision-making by providing real-time insights, centralised reporting, better visibility into business performance, and easier access to key metrics.
Some key benefits include:
- Better decision-making
- Real-time dashboards
- Improved reporting
- Data visualisation
- Business performance monitoring
- Greater operational visibility
Business intelligence supports multiple departments, including sales, finance, operations, human resources, customer service, and executive leadership.
Traditional reporting provides static reports generated periodically, while Business Intelligence delivers interactive dashboards, real-time insights, automated reporting, and deeper data analysis.
iDashboard helps organisations connect data from multiple sources, create interactive dashboards, monitor KPIs, generate automated reports, and visualise business performance through a self-service Business Intelligence platform.
